
29 Oct 2018
【ML】1 感知机
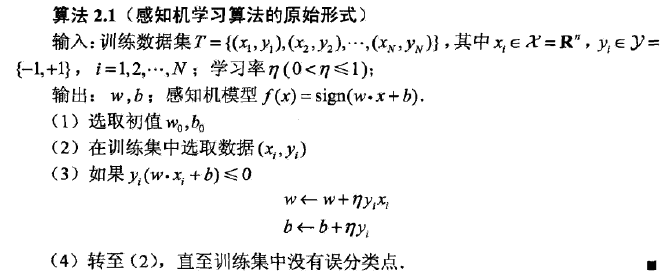
算法2.1 感知机学习算法的原始形式
#!/user/bin/env python
# coding:utf-8
'''
Created on 2018-11-03
Upgrate on 2018-11-03
Anthor: Moriarty12138
Github: https://github.com/Moriarty12138/machine-learning-practice
'''
import numpy as np
import matplotlib.pyplot as plt
from sklearn.datasets import load_boston

class Perceptron:
    def __init__(self, x, y, a=1):
        self.x = x
        self.y = y
        self.w = np.zero((x.shape[1], 1))
        self.b = 0
        self.eta = 1
        self.numamples = self.x.shape[0]
        self.numfeatures = self.x.shape[1]

    def sign(self, w, b, x):
        y = np.dot(x, w) + b
        return int(y)

    def upgrate(self, label_i, data_i):
        tmp = label_i * self.a * data_i
        tmp = tmp.reshape(self.w.shape)
        self.w = tmp + self.w
        self.b = self.b + label_i * self.a

        def train(self):
            isFind = False
            while not isFind:
                count = 0
                for i in range(self.numsamples):
                    tmpY = self.sign(self.w, self.b, self.x[i, :])
                    if tmpY * self.y[i] <= 0:
                        print
                        '误分类点为:', self.x[i, :], '此时的w和b为:', self.w, self.b
                        count += 1
                        self.update(self.y[i], self.x[i, :])
                if count == 0:
                    print
                    '最终训练得到的w和b为:', self.w, self.b
                    isFind = True
            return self.w, self.b

class Picture:
    def __init__(self,data,w,b):
        self.b=b
        self.w=w
        plt.figure(1)
        plt.title('Perceptron Learning Algorithm',size=14)
        plt.xlabel('x0-axis',size=14)
        plt.ylabel('x1-axis',size=14)

        xData=np.linspace(0,5,100)
        yData=self.expression(xData)
        plt.plot(xData,yData,color='r',label='sample data')

        plt.scatter(data[0][0],data[0][1],s=50)
        plt.scatter(data[1][0],data[1][1],s=50)
        plt.scatter(data[2][0],data[2][1],s=50,marker='x')
        plt.scatter(data[3][0],data[3][1],s=50,marker='x')
        plt.savefig('2d.png',dpi=75)

    def expression(self,x):
        y=(-self.b-self.w[0]*x)/self.w[1]
        return y

    def Show(self):
        plt.show()

if __name__ == '__main__':
    samples,labels=load_boston()
    myperceptron=Perceptron(x=samples,y=labels)
    weights,bias=myperceptron.train()
    Picture=Picture(samples,weights,bias)
    Picture.Show()
Til next time,
gentlesnow
at 21:31
